Free, open exam prep for BEE Energy Managers & Auditors · Paper-1 & Paper-3
Paper-3 — Formula & Concept Guide
For every formula: what each symbol means and its unit, what the formula tells you, a worked example from a real exam question, and the exam trap. Plus 26 photographs of the actual equipment, 16 diagrams, 20 constants, 48 definitions and 23 verified online videos. Values are the 2014 BEE Book-3's.
▶ Download the whole guide as one PDF · Numericals drill
- 1 TR (Ton of Refrigeration) in kcal/hr
- 3024 kcal/hr
- 1 TR in kW
- 3.51 kW
- 1 TR in BTU/hr
- 12,000 BTU/hr
- 1 kW in kcal/hr
- 860 kcal/hr
- 1 kWh in kcal
- 860 kcal
- 1 BHP in kW
- 0.746 kW
- Acceleration due to gravity, g
- 9.81 m/s²
- Density and specific heat of water
- 1000 kg/m³ ; Cp = 1 kcal/kg °C
- 1 kg/cm² pressure as water head
- 10 m of water column
- 1 m³/min in cfm
- 35.31 cfm
- Density of air at 0 °C (fans)
- 1.293 kg/m³
- Molecular weight of air
- 28.92 kg/kg-mole
- Maximum luminous efficacy
- 683 lm/W at 555 nm
- Condenser water flow per TR
- 0.91 m³/hr per TR (4 gpm/TR)
- Evaporation per 10,00,000 kcal heat rejected (cooling tower)
- 1.8 m³
- DG exhaust gas: mass per kWh and Cp
- 8 kg/kWh ; 0.25 kcal/kg °C
- Stray load loss of a motor (IS/IEC)
- 0.5 % of input power
- Why 102 in fan efficiency formula
- 1000 ÷ 9.81 (converts m³/s × mmWC into kW)
- Temperature in Kelvin
- K = °C + 273
- ECBC applies to buildings with
- connected load ≥ 100 kW or contract demand ≥ 120 kVA
Chapter 1 · Electrical Systems
~23 marks (15 %) — the top chapter with HVAC. PF/kVAr, transformer losses at part load, maximum demand and AT&C losses come every year as numericals.


Power factor
| Symbols | kW = real power, kVA = apparent power | |
| Answer unit | no unit (0 to 1) | |
| Book topic | Power factor |
Where each value sits: kW → kVA, kVAr, kW · kVA → kVA, kVAr, kW
▶ Try it: Power factor: add capacitor kVAr — watch the triangle shrink
The fraction of the current that does real work. PF = 1 means every ampere is useful; PF 0.7 means the cables and transformer carry 43 % more current than the work needs.
Apparent power, 3-phase
| Symbols | V = line voltage (V), I = line current (A) | |
| Answer unit | kVA | |
| Book topic | Power triangle |
Where each value sits: V → receiving-end Er, V · I → copper / load loss ∝ load²
What the supply actually has to deliver — the voltage times the current, before asking how much of it does work. Cables, switchgear and transformers are rated in kVA for this reason.
Real power, 3-phase
| Symbols | V (V), I (A), PF (no unit) | |
| Answer unit | kW | |
| Book topic | Power triangle |
Where each value sits: V → receiving-end Er, V · I → copper / load loss ∝ load² · PF → kVAr, φ₁, φ₂, PF
The power that turns into heat, motion or light — what the kWh meter records. It is the apparent power times the power factor.
Relation between kW, kVAr and kVA
| Symbols | kW, kVAr, kVA | |
| Answer unit | kVA | |
| Book topic | Power triangle |
Where each value sits: kW → kVA, kVAr, kW · kVAr → kVA, kVAr, kW · kVA → kVA, kVAr, kW
▶ Try it: Power factor: add capacitor kVAr — watch the triangle shrink
Pythagoras on the power triangle: kW along the base, kVAr up the side, kVA on the diagonal. Given any two you can find the third.
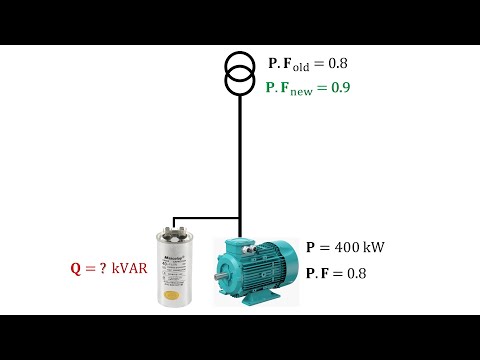
Capacitor rating to improve power factor
| Symbols | kW = average operating load; φ₁ = cos⁻¹(existing PF); φ₂ = cos⁻¹(improved PF) | |
| Answer unit | kVAr | |
| Book topic | PF correction |
Where each value sits: kW → % load, kVA, kW · φ₁ → kVAr, φ₁, φ₂, PF · φ₂ → kVAr, φ₁, φ₂, PF
▶ Try it: Power factor: add capacitor kVAr — watch the triangle shrink
How many kVAr of capacitors to add so the existing kW load reaches the target PF. Convert each PF to its angle (φ = cos⁻¹ PF), take the tangents, multiply the difference by the kW.
Line (copper) loss
| Symbols | I = current (A), R = resistance (Ω) | |
| Answer unit | W | |
| Book topic | Distribution losses |
Where each value sits: I → copper / load loss ∝ load² · R → copper / load loss ∝ load²
Heat wasted in a conductor. Because it depends on the SQUARE of the current, halving the current (by raising voltage or improving PF) cuts the loss to a quarter.
% reduction in distribution loss when tail-end PF is raised
| Symbols | PF₁ = existing PF, PF₂ = improved PF | |
| Answer unit | % | |
| Book topic | Location of capacitors |
Where each value sits: PF₁ → kVAr, φ₁, φ₂, PF · PF₂ → kVAr, φ₁, φ₂, PF
Raising the PF at the load end lowers the current for the same kW, so the I²R loss in the upstream cables falls by 1 − (old PF ÷ new PF)².
Maximum demand registered by MD meter
| Symbols | kVA of each period; duration in minutes | |
| Answer unit | kVA | |
| Book topic | Maximum demand |
Where each value sits: kVA → kVA × minutes / 30-min interval · duration → kVA × minutes / 30-min interval
The meter averages kVA over each 30-minute window and remembers the highest window of the month. You pay demand charges on that peak even if it happened once.
Transformer loss at any load (from % load)
| Symbols | no-load (iron) loss and full-load copper loss in kW or W | |
| Answer unit | kW (or W) | |
| Book topic | Transformer losses |
Where each value sits: no-load → iron / no-load loss (constant)

▶ Try it: Transformer: load it up — iron loss stays flat, copper loss grows with load²
Iron (no-load) loss is constant whenever the transformer is energised; copper (load) loss rises with the SQUARE of the load. Efficiency is highest where the two are equal.
Transformer loss at any load (from kVA)
| Symbols | kVA; losses in kW or W | |
| Answer unit | kW (or W) | |
| Book topic | Transformer losses |
Where each value sits: kVA → kVA, kVAr, kW · losses → kVA, kVAr, kW
▶ Try it: Transformer: load it up — iron loss stays flat, copper loss grows with load²
Same idea using the actual kVA carried: the load fraction is actual ÷ rated kVA.
Voltage regulation
| Symbols | Es = sending-end voltage, Er = receiving-end voltage (V) | |
| Answer unit | % | |
| Book topic | Voltage regulation |
Where each value sits: Es → sending-end Es · Er → receiving-end Er, V
How much the voltage drops between the sending and receiving end under load, as a percentage of the receiving-end voltage; big drops mean long or overloaded lines.
Input energy of a distribution area
| Symbols | energy in MU (million units) | |
| Answer unit | MU | |
| Book topic | AT&C losses |
Where each value sits: energy → energy needed at end use
The energy a DISCOM area actually receives to sell: what it imports minus what it exports to neighbouring areas.
Billing efficiency
| Symbols | Eb = total energy billed (MU), Ei = input energy (MU) | |
| Answer unit | % | |
| Book topic | AT&C losses |
Where each value sits: Eb → energy billed Eb · Ei → input energy Ei (import − export)
Share of the input energy that was actually billed to consumers (metered + un-metered). The rest is technical loss plus theft/unbilled use.
Amount collected without arrears
| Symbols | AG = gross amount collected, Ar = arrears collected (Rs) | |
| Answer unit | Rs | |
| Book topic | AT&C losses |
Where each value sits: AG → amount billed Ab, collected AG, arrears Ar · Ar → amount billed Ab, collected AG, arrears Ar
Money collected for THIS year's bills only — arrears belong to earlier years and would inflate the collection efficiency.
Collection efficiency
| Symbols | Ac = amount collected without arrears, Ab = amount billed (Rs) | |
| Answer unit | % | |
| Book topic | AT&C losses |
Where each value sits: Ac → amount billed Ab, collected AG, arrears Ar · Ab → energy billed Eb
Share of the amount billed that was actually paid (this year's bills).
AT&C (Aggregate Technical & Commercial) loss
| Symbols | BE and CE as fractions | |
| Answer unit | % | |
| Book topic | AT&C losses |
Where each value sits: BE → billing efficiency BE
The DISCOM's total loss: energy lost technically AND commercially (not billed, not collected) as one number — 1 minus the product of the two efficiencies.
Total harmonic distortion of current
| Symbols | I₁ = fundamental current (A); I₃, I₅… = harmonic currents (A) | |
| Answer unit | % | |
| Book topic | Harmonics |
Where each value sits: I₁ → I₁ fundamental · I₃ → I₃, I₅, I₇ harmonics · I₅… → I₃, I₅, I₇ harmonics
How much the current waveform is polluted by frequencies at multiples of 50 Hz (from VFDs, UPS, rectifiers, CFLs). Root-sum-square of the harmonic currents divided by the fundamental.
Overall efficiency of an energy chain
| Symbols | each efficiency as a fraction | |
| Answer unit | % (or fraction) | |
| Book topic | 1 unit saved = 2 units generated |
Where each value sits: each → η₁ × η₂ × η₃
Efficiencies in series multiply. From power station to the motor shaft the book's chain is 0.83 (generation & T&D) × 0.95 × 0.9 × 0.7 ≈ 0.50.
Energy to be generated for a given end use
| Symbols | kWh; η as fraction | |
| Answer unit | kWh | |
| Book topic | 1 unit saved = 2 units generated |
Where each value sits: kWh → energy needed at end use · η: η as fraction
Because the chain is only ~50 % efficient, every unit saved at the end use saves about two units at the power station — 'one unit saved = two units generated'.
Power triangle — what a capacitor does
Transformer losses vs load
- Maximum demand and load factor
- MD is the highest 30-minute average kVA in the month; load factor = average load ÷ maximum demand. Improving load factor (shifting loads off-peak) cuts demand charges.
- TOD tariff
- Time-of-day tariff charges more in peak hours and less off-peak, to encourage shifting load.
- Harmonics
- Currents at multiples of 50 Hz from non-linear loads (VFDs, UPS, rectifiers, CFLs); they heat transformers, trip breakers and distort voltage. Resistive heaters and incandescent lamps create none.
- Automatic PF controller
- Switches capacitor steps in and out to hold the target PF as load changes; capacitors at the load end also cut cable losses.
- DSM
- Demand-side management: the utility shapes customer load — peak clipping, valley filling, load shifting, strategic conservation.
Chapter 2 · Electric Motors
~10 marks: many easy objectives (losses, speed, slip, IE classes) plus the loading and replacement-saving numericals.


Synchronous speed
| Symbols | f = supply frequency (Hz), P = number of poles | |
| Answer unit | rpm | |
| Book topic | Motor speed |
Where each value sits: f → synchronous speed Ns, poles P · P → synchronous speed Ns, poles P

The speed of the rotating magnetic field; the rotor can never quite reach it. Indian 50 Hz speeds: 3,000 / 1,500 / 1,000 / 750 / 600 / 500 rpm for 2 / 4 / 6 / 8 / 10 / 12 poles.
Slip
| Symbols | Ns = synchronous speed, N = actual full-load speed (rpm) | |
| Answer unit | % | |
| Book topic | Motor speed |
Where each value sits: Ns → synchronous speed Ns, poles P · N → rotor speed N, slip
How far the rotor lags the field, as a percentage. Full-load slip of a good motor is 2–5 %; slip rises with load and with poor rotor design (rewinding damage).
Motor power factor
| Symbols | kW, kVA | |
| Answer unit | no unit | |
| Book topic | Power factor |
Where each value sits: kW → input kW · kVA → V, I, cos φ, f
As load falls the working current drops but the magnetising current does not, so PF collapses at light load — lightly loaded motors are the main cause of poor plant PF.
Motor efficiency
| Symbols | P out = output, P in = input, P loss = losses (kW) | |
| Answer unit | % (or fraction) | |
| Book topic | Motor efficiency |
Where each value sits: P out → synchronous speed Ns, poles P · P in → synchronous speed Ns, poles P · P loss → synchronous speed Ns, poles P
Output at the shaft divided by electrical input; the difference is heat (I²R in stator and rotor, core, friction & windage, stray). Efficiency is flat from 50–100 % load and falls steeply below 40 %.
Input power of a 3-phase motor
| Symbols | kV = line voltage (kV), I = current (A) | |
| Answer unit | kW | |
| Book topic | Motor loading |
Where each value sits: kV → V, I, cos φ, f · I → V, I, cos φ, f
▶ Try it: Motor: measured volts, amps and PF → loading %
The electrical power the motor is drawing right now, from measured volts, amps and PF.
Friction & windage + core loss (no-load test)
| Symbols | W, A, Ω | |
| Answer unit | W | |
| Book topic | Field tests |
Where each value sits: no-load kW → input kW · I no-load → V, I, cos φ, f · R stator → stator I²R, resistance R · F&W + core → losses, F&W, core, stray
Run the motor unloaded: nearly all the input is core loss plus bearing/fan (friction & windage) loss, after subtracting the small stator I²R at no-load current.
Stator resistance corrected to operating temperature
| Symbols | R₁ = resistance at ambient t₁ (°C); t₂ = operating temperature (°C) | |
| Answer unit | Ω | |
| Book topic | Field tests |
Where each value sits: R₁ → stator I²R, resistance R · t₂ → temperature t₁, t₂

Copper resistance rises with temperature; the resistance measured cold must be scaled to the running temperature (100–120 °C for modern motors) before calculating I²R loss.
Rotor I²R (copper) loss
| Symbols | slip as a fraction; powers in W | |
| Answer unit | W | |
| Book topic | Field tests |
Where each value sits: slip → rotor speed N, slip · powers → synchronous speed Ns, poles P
Rotor loss is the slip fraction of the power crossing the air gap (stator input minus stator losses).
Stray load loss (IS/IEC method)
| Symbols | input power (W) | |
| Answer unit | W | |
| Book topic | Field tests |
Where each value sits: input → V, I, cos φ, f
Losses that cannot be measured directly (leakage flux, harmonics); the Indian/IEC standard simply assumes 0.5 % of input.
Motor % loading (input method)
| Symbols | kW; η as fraction | |
| Answer unit | % | |
| Book topic | Motor loading |
Where each value sits: kW → input kW · η → output kW, η
▶ Try it: Motor: measured volts, amps and PF → loading %
Compare measured input with the input the motor would draw at full load (nameplate kW ÷ nameplate efficiency).
Motor % loading (output method)
| Symbols | kW | |
| Answer unit | % | |
| Book topic | Motor loading |
Where each value sits: kW → input kW
Actual mechanical load divided by rated output — used when the shaft load is known (e.g. from pump duty).
Saving by replacing with an energy-efficient motor
| Symbols | η old, η new as fractions | |
| Answer unit | kW | |
| Book topic | High-efficiency motors |
Where each value sits: η → output kW, η · η → output kW, η
For the same output, a more efficient motor draws less input; the saving is the difference of the two inputs.
Voltage unbalance (NEMA)
| Symbols | line voltages (V) | |
| Answer unit | % | |
| Book topic | Voltage unbalance |
Where each value sits: line → V, I, cos φ, f

Unequal phase voltages; even 1 % unbalance causes 6–10× that in current unbalance and overheats the motor.
Additional temperature rise due to voltage unbalance
| Symbols | % unbalance | |
| Answer unit | °C | |
| Book topic | Voltage unbalance |
Where each value sits: % → Vab, Vbc, Vca
Each 10 °C hotter halves insulation life; a 2 % unbalance adds 8 °C.
Motor efficiency and power factor vs load
- Motor losses (book split)
- Stator + rotor I²R 55–60 %, iron/core 20–25 %, friction & windage 8–12 %, stray 4–5 %.
- Energy-efficient motors
- IE2/IE3 (IS 12615): lower losses through better steel, more copper, better fans; saving = kW(1/η_old − 1/η_new).
- Rewinding
- A poorly rewound motor loses 1–2 % efficiency; check no-load current and stator resistance per phase before and after.
- Star-delta / star mode
- A motor loaded below ~40 % runs better permanently in star (√3 lower voltage): higher efficiency and PF, less magnetising current.
- Soft starter
- Limits inrush current and mechanical shock at start; it does NOT improve running efficiency.
Chapter 3 · Compressed Air System
~20 marks: FAD, leakage, specific power and receiver/pipe sizing numericals; intercooling and dryer theory.


Compressor displacement
| Symbols | D = bore (m), L = stroke (m), S = speed (rpm), X = 1 single / 2 double acting, n = no. of cylinders | |
| Answer unit | m³/min | |
| Book topic | Volumetric efficiency |
Where each value sits: D → bore D, stroke L, speed S, X, n · L → bore D, stroke L, speed S, X, n · S → bore D, stroke L, speed S, X, n · X → bore D, stroke L, speed S, X, n · n → bore D, stroke L, speed S, X, n

The volume the pistons sweep per minute — the theoretical maximum the machine could deliver.
Volumetric efficiency
| Symbols | both in m³/min | |
| Answer unit | % | |
| Book topic | Volumetric efficiency |
Where each value sits: both → FAD Q, displacement
How much of the swept volume actually comes out as free air; clearance volume, leakage and valve losses take the rest (typically 65–85 %).
Isothermal power
| Symbols | P₁ = absolute intake pressure (kg/cm²), Q₁ = FAD (m³/hr), r = P₂ ÷ P₁ | |
| Answer unit | kW | |
| Book topic | Isothermal efficiency |
Where each value sits: P₁ → P₁ intake, P₂ delivery, r = P₂/P₁ · Q₁ → FAD Q, displacement · r → receiver V, P₁ → P₂, time T
The ideal power if the air were compressed at constant temperature — the lowest possible. Uses the natural log of the pressure ratio.
Isothermal efficiency
| Symbols | kW | |
| Answer unit | % | |
| Book topic | Isothermal efficiency |
Where each value sits: kW → input kW, isothermal kW, SPC
Ideal power divided by what the compressor and motor actually draw — the reported compressor efficiency (typically 60–70 %).
Free air delivery by pump-up test
| Symbols | P₂ final, P₁ initial, P₀ atmospheric (kg/cm² abs); V = receiver + pipe volume (m³); T = time (min) | |
| Answer unit | m³/min | |
| Book topic | Capacity assessment |
Where each value sits: P₂ → receiver V, P₁ → P₂, time T · P₁ → receiver V, P₁ → P₂, time T · P₀ → P₁ intake, P₂ delivery, r = P₂/P₁ · V → receiver V, P₁ → P₂, time T · T → T load, t unload
Shop-floor capacity test: isolate the receiver, time how long the compressor takes to raise its pressure from P₁ to P₂; the air delivered is the receiver volume times the pressure rise in atmospheres, per minute.
Leakage % (load–unload test)
| Symbols | T = load (on) time, t = unload (off) time — same units | |
| Answer unit | % | |
| Book topic | Leakage test |
Where each value sits: T → T load, t unload · t → T load, t unload
▶ Try it: Compressed air: load and unload times → leakage
With no consumers connected, the compressor still loads periodically to replace leaked air; the fraction of time it spends loaded is the leakage fraction.
Leakage quantity
| Symbols | Q = compressor capacity (m³/min) | |
| Answer unit | m³/min | |
| Book topic | Leakage test |
Where each value sits: Q → FAD Q, displacement
▶ Try it: Compressed air: load and unload times → leakage
Leakage in flow units = compressor capacity × leakage fraction.
Specific power consumption
| Symbols | kW, m³/min | |
| Answer unit | kW per m³/min | |
| Book topic | Performance |
Where each value sits: kW → input kW, isothermal kW, SPC · m³/min → FAD Q, displacement
▶ Try it: Chiller: flow and temperature drop of chilled water → tons of refrigeration
kW per unit of air delivered — the efficiency benchmark of a compressed-air system (typical 0.15–0.20 kW/cfm... in book units ≈ 6–8 kW per m³/min).
Power wasted in leakage
| Symbols | m³/min × kW per m³/min | |
| Answer unit | kW | |
| Book topic | Leakage test |
Where each value sits: m³/min → input kW, isothermal kW, SPC
Leaked air cost you the power to compress it: leakage flow × specific power.
Gas law (air expansion / compression)
| Symbols | absolute pressure; volume; temperature in K | |
| Answer unit | — | |
| Book topic | Pipe & receiver sizing |
Where each value sits: absolute → P₁ intake, P₂ delivery, r = P₂/P₁ · volume → receiver V, P₁ → P₂, time T · temperature → T load, t unload
Relates pressure, volume and temperature of the same air at two states — used to convert free air to line-pressure volume for pipe sizing.
Compressed air pipe diameter
| Symbols | Q = flow at line pressure (m³/s), v = air velocity (m/s) | |
| Answer unit | m | |
| Book topic | Pipe sizing |
Where each value sits: Q → FAD Q, displacement · v → receiver V, P₁ → P₂, time T

Choose the pipe so the air (at line pressure) moves at 6–10 m/s; faster means high pressure drop.
Air receiver size
| Symbols | output in m³/min | |
| Answer unit | m³ | |
| Book topic | Air receivers |
Where each value sits: output → capacity, rated vs actual
Storage that smooths demand peaks and reduces load/unload cycling; IS 7938 rule of thumb.
Capacity shortfall of a compressor
| Symbols | m³/min | |
| Answer unit | % | |
| Book topic | Capacity assessment |
Where each value sits: m³/min → FAD Q, displacement
Compares tested FAD with the rated value; a shortfall above ~10 % means worn valves, rings or leaks and calls for overhaul.
m³/min to cfm
| Symbols | m³/min | |
| Answer unit | cfm | |
| Book topic | Units |
Where each value sits: m³/min → FAD Q, displacement
Unit bridge between the book's SI values and nameplates in cfm.
Leakage test — load/unload timeline
FAD pump-up test
- Types of compressors
- Positive displacement (reciprocating, screw, vane) and dynamic (centrifugal). Centrifugal machines do not use load/unload capacity control.
- Intercooling
- Cooling air between stages reduces its volume so the next stage does less work — the main reason multi-stage compression saves power.
- Air dryers
- Refrigerated (dew point +3 °C, cheapest power), heatless desiccant (uses 15–20 % purge air, highest cost), heat-of-compression (lowest operating cost); adsorption dryers use activated alumina / silica gel / molecular sieve.
- Pressure settings
- Every 1 bar reduction in delivery pressure saves 6–7 % power; each 4 °C rise in intake temperature costs ~1 %.
- Leakage benchmarks
- Well-maintained system < 10 % of capacity; badly maintained 20–30 %.
Chapter 4 · HVAC and Refrigeration System
~23 marks (top chapter): TR, COP, kW/TR numericals every year; VCR vs VAM, refrigerants, psychrometry and ventilation.


Refrigeration load from chilled water
| Symbols | Q = coolant flow (kg/hr), Cp (kcal/kg °C), Ti, To = inlet, outlet temperature (°C) | |
| Answer unit | TR | |
| Book topic | Performance assessment |
Where each value sits: Q → Q flow kg/hr, Cp, Ti, To → TR · Cp → Q flow kg/hr, Cp, Ti, To → TR · Ti → Q flow kg/hr, Cp, Ti, To → TR · To → Q flow kg/hr, Cp, Ti, To → TR · outlet: outlet temperature (°C)

▶ Try it: Chiller: flow and temperature drop of chilled water → tons of refrigeration
Heat removed from the chilled water = flow × specific heat × temperature drop; divided by 3,024 to give tons of refrigeration.
Refrigeration load from air side (AHU / FCU)
| Symbols | Q = air flow (m³/hr), ρ = air density (kg/m³), h = enthalpy (kcal/kg) | |
| Answer unit | TR | |
| Book topic | Performance assessment |
Where each value sits: Q → Q flow kg/hr, Cp, Ti, To → TR · ρ → air flow, ρ, h in/out, ACH, L×B×H · h → air flow, ρ, h in/out, ACH, L×B×H
Same idea on the air side: air mass flow × enthalpy drop across the coil, read from the psychrometric chart.
Specific power consumption
| Symbols | kW, TR | |
| Answer unit | kW/TR | |
| Book topic | Performance assessment |
Where each value sits: kW → power input kW, W · TR → Q flow kg/hr, Cp, Ti, To → TR
▶ Try it: Chiller: flow and temperature drop of chilled water → tons of refrigeration
The benchmark of a refrigeration plant: kW drawn per ton produced. Good centrifugal chillers ≈ 0.6–0.7 kW/TR; reciprocating ≈ 1.0–1.2.
Overall kW/TR of a chilled-water plant
| Symbols | each in kW/TR | |
| Answer unit | kW/TR | |
| Book topic | Performance assessment |
Where each value sits: each → COP, kW/TR, EER
Add the pumps and cooling-tower fan to the compressor — the plant benchmark, not just the chiller's.
Coefficient of performance
| Symbols | both in the same units (kW ÷ kW) | |
| Answer unit | no unit | |
| Book topic | COP |
Where each value sits: both → power input kW, W
▶ Try it: Chiller: flow and temperature drop of chilled water → tons of refrigeration
Cooling produced per unit of work input, both in the same units. Higher COP = more efficient. Typical VCR 3–5; single-effect VAM ≈ 0.65–0.7.
COP from kW/TR
| Symbols | 1 TR = 3.51 kW | |
| Answer unit | no unit | |
| Book topic | COP |
Where each value sits: 1 TR → Q flow kg/hr, Cp, Ti, To → TR
▶ Try it: Chiller: flow and temperature drop of chilled water → tons of refrigeration
Because 1 TR = 3.51 kW of cooling, COP is simply 3.51 divided by the kW/TR.
Carnot COP
| Symbols | Te = evaporator, Tc = condenser temperature (K = °C + 273) | |
| Answer unit | no unit | |
| Book topic | COP |
Where each value sits: Te → Te evaporator · Tc → heat rejected, Tc
The theoretical best for the two temperatures; shows why a HIGHER evaporator temperature and LOWER condenser temperature raise efficiency (≈ 2–3 % per °C).
Energy efficiency ratio (star label)
| Symbols | W, W | |
| Answer unit | W/W | |
| Book topic | Room AC labelling |
Where each value sits: W → power input kW, W · W → power input kW, W

COP expressed in watts of cooling per watt of input (or BTU/hr per W in older labels); the basis of the BEE star rating for room ACs.
Heat rejected in the condenser
| Symbols | TR × 3024 + kW × 860 (kcal/hr) | |
| Answer unit | kcal/hr | |
| Book topic | Refrigeration cycle |
Where each value sits: TR → Q flow kg/hr, Cp, Ti, To → TR
The condenser must dump the heat taken from the room PLUS the compressor's work — always more than the cooling effect.
Heat delivered by a heat pump
| Symbols | Qe = waste heat taken in (kW), W = compressor work (kW) | |
| Answer unit | kW | |
| Book topic | Heat pumps |
Where each value sits: Qe → Q flow kg/hr, Cp, Ti, To → TR · W → power input kW, W
A heat pump is a refrigerator used for its hot side: it delivers the waste heat it absorbed plus the compressor work, so heating COP is always > 1.
Ventilation rate
| Symbols | L, B, H = room size (m), ACH = air changes per hour | |
| Answer unit | m³/hr | |
| Book topic | Ventilation |
Where each value sits: L → air flow, ρ, h in/out, ACH, L×B×H · B → air flow, ρ, h in/out, ACH, L×B×H · H → air flow, ρ, h in/out, ACH, L×B×H · ACH → air flow, ρ, h in/out, ACH, L×B×H
Air changes per hour times the room volume gives the fan duty for ventilating a room (compressor rooms 10–20 ACH, engine rooms 20).
Water added in humidification
| Symbols | V = air flow (m³/hr), ρ (kg/m³), w = specific humidity (kg/kg dry air) | |
| Answer unit | kg/hr | |
| Book topic | Humidification |
Where each value sits: V → Q flow kg/hr, Cp, Ti, To → TR · ρ → air flow, ρ, h in/out, ACH, L×B×H · w → power input kW, W
Spraying water into air raises its moisture content; the water needed is the air mass flow times the rise in specific humidity.
Condenser water flow norm
| Symbols | TR | |
| Answer unit | m³/hr per TR | |
| Book topic | Performance assessment |
Where each value sits: TR → Q flow kg/hr, Cp, Ti, To → TR
Design rule: about 0.91 m³/hr (4 US gpm) of cooling water per ton — used to check whether the condenser is starved of water.
Vapour-compression cycle
Psychrometric chart basics
- Vapour compression vs absorption
- VCR: compressor (electrical) drives the cycle, COP 3–5. VAM: generator (heat) drives it with absorbent LiBr or water-ammonia, COP 0.65–1.2, uses waste heat/steam. Ammonia is the refrigerant common to both; 'generator' is the VAM part that is NOT in VCR; 'absorber' likewise.
- Refrigerants
- CFCs (R-11, R-12) phased out for ozone; HCFC R-22 being phased out; HFC R-134a; natural: ammonia (R-717), CO₂, hydrocarbons.
- Chilled-water temperature
- Raising the chilled-water leaving temperature by 1 °C improves compressor efficiency ≈ 3 %; lowering condenser temperature does the same.
- Psychrometry terms
- DBT, WBT, RH, dew point, specific humidity, enthalpy; when DBT = WBT the air is saturated.
- Star labelling of room ACs
- Based on EER (W/W) at standard test conditions; higher EER = more stars.
Chapter 5 · Fans and Blowers
~11 marks: fan laws (power ∝ N³) and static-efficiency numericals; fan types, dampers vs VFD, ASME classification.


ASME specific ratio
| Symbols | absolute pressures | |
| Answer unit | no unit (fan ≤ 1.11, blower 1.11–1.20, compressor > 1.20) | |
| Book topic | Fan / blower / compressor |
Where each value sits: absolute → duct area A

Fans, blowers and compressors are classified by the pressure ratio they develop, not by their construction.
Fan law – flow
| Symbols | N = fan speed (rpm) | |
| Answer unit | m³/s (same as Q₁) | |
| Book topic | Fan laws |
Where each value sits: N → speed N
▶ Try it: Fan laws: slow the fan down — power falls with the CUBE of speed
Flow is directly proportional to speed: 10 % less speed = 10 % less air.
Fan law – pressure
| Symbols | N (rpm) | |
| Answer unit | mmWC | |
| Book topic | Fan laws |
Where each value sits: N → speed N
▶ Try it: Fan laws: slow the fan down — power falls with the CUBE of speed
Pressure rises with the square of speed.
Fan law – power
| Symbols | N (rpm) | |
| Answer unit | kW | |
| Book topic | Fan laws |
Where each value sits: N → speed N
▶ Try it: Fan laws: slow the fan down — power falls with the CUBE of speed
Power rises with the CUBE of speed — the whole case for VFDs on fans: 20 % less flow needs only 51 % of the power.
Total pressure
| Symbols | SP = static, VP = velocity pressure (mmWC) | |
| Answer unit | mmWC | |
| Book topic | Fan performance |
Where each value sits: SP → static pressure outlet · VP → velocity pressure Δp, Cp
Total = static (pushes on the duct walls) + velocity (from the moving air).
Air velocity from pitot-tube reading
| Symbols | Cp = pitot coefficient (≈ 0.85), Δp = velocity pressure (mmWC), γ = gas density (kg/m³) | |
| Answer unit | m/s | |
| Book topic | Flow measurement |
Where each value sits: Cp → velocity pressure Δp, Cp · Δp → velocity pressure Δp, Cp · γ → gas density γ, T, M
Convert the velocity-pressure reading on a manometer into air speed, corrected for the pitot coefficient and the gas density.
Gas density (ideal gas)
| Symbols | P = absolute pressure (mmWC), M = mol. weight (air 28.92), R = 847.84 mmWC·m³/kg-mole·K, T (K) | |
| Answer unit | kg/m³ | |
| Book topic | Flow measurement |
Where each value sits: P → gas density γ, T, M · M → gas density γ, T, M · R → gas density γ, T, M · m³/kg-mole → gas density γ, T, M · K: K · T → gas density γ, T, M
Density falls as the gas gets hotter or the pressure drops; needed before velocity and mass-flow calculations for hot flue gas.
Air density at t °C
| Symbols | 1.293 kg/m³ at 0 °C; t (°C) | |
| Answer unit | kg/m³ | |
| Book topic | Flow measurement |
Where each value sits: 1.293: 1.293 kg/m³ at 0 °C · t → gas density γ, T, M
Quick correction from the standard 1.293 kg/m³ at 0 °C.
Molecular weight of flue gas (dry)
| Symbols | gas analysis in % (dry basis) | |
| Answer unit | kg/kg-mole | |
| Book topic | Flow measurement |
Where each value sits: %CO₂ %O₂ %CO %N₂ → gas density γ, T, M · M → gas density γ, T, M
Weighted average of the gases in the flue-gas analysis; used in the density formula for boiler ID/FD fans.
Volume flow in a duct
| Symbols | m/s × m² | |
| Answer unit | m³/s | |
| Book topic | Flow measurement |
Where each value sits: m/s → gas density γ, T, M
Average velocity from a pitot traverse times the duct cross-section.
Fan mechanical (total) efficiency
| Symbols | Q (m³/s), TP = total pressure (mmWC), shaft power (kW) | |
| Answer unit | % | |
| Book topic | Fan efficiency |
Where each value sits: Q → air flow Q · TP → static pressure outlet · shaft → motor kW, η motor
How well the shaft power becomes air power, counting both static and velocity pressure.
Fan static efficiency
| Symbols | Q (m³/s), SP = static pressure rise (mmWC), shaft power (kW) | |
| Answer unit | % | |
| Book topic | Fan efficiency |
Where each value sits: Q → air flow Q · SP → static pressure outlet · shaft → motor kW, η motor
Same, but counting only the static pressure rise — the usual figure quoted, and what the exam asks (2019 L-1, 2021 S-7).
Power input to fan shaft
| Symbols | kW; η as fractions | |
| Answer unit | kW | |
| Book topic | Fan efficiency |
Where each value sits: kW → motor kW, η motor · η: η as fractions
Motor input kW is not fan input: subtract the motor loss and, for belt drives, the belt loss.
Static pressure rise across the fan
| Symbols | inlet (suction) pressure is negative (mmWC) | |
| Answer unit | mmWC | |
| Book topic | Fan performance |
Where each value sits: inlet → static pressure inlet
The pressure the fan adds: outlet static minus inlet static, remembering the inlet is usually below atmosphere.
The three fan laws
Static pressure rise across a fan
- Fan types
- Centrifugal: radial (dust), forward-curved (low pressure, HVAC), backward-curved/inclined (non-overloading, most efficient). Axial: propeller, tube-axial, vane-axial — air does not change direction.
- System resistance
- Depends on ducts, bends, dampers, pickups; ∝ flow². Larger ducts and fewer bends lower it.
- Flow control
- Damper (wastes energy), inlet guide vanes (better, modest range), variable speed (best — power ∝ N³), pulley change (cheap, permanent).
- Non-overloading fan
- Backward-curved fans — power peaks then falls with flow, so the motor cannot be overloaded.
Chapter 6 · Pumps and Pumping System
~18 marks: pump power (ρgQH), efficiency and affinity/impeller-trimming numericals; throttling vs VFD; NPSH and cavitation.


Hydraulic power
| Symbols | Q (m³/s), hd = discharge head, hs = suction head (m), ρ (kg/m³), g = 9.81 m/s² | |
| Answer unit | kW | |
| Book topic | Pump power |
Where each value sits: Q → pipe: flow Q · hd → discharge head hd · hs → suction head hs · ρ → liquid ρ · g → g = 9.81 m/s²
▶ Try it: Pump: change flow and head — watch the water rise and the power change
The power actually given to the water: how much flows (Q) times how high it is lifted (head) times the weight of water. This is the useful output of the pump.
Pump shaft power
| Symbols | kW; η as fraction | |
| Answer unit | kW | |
| Book topic | Pump power |
Where each value sits: Ph → hydraulic power Ph · η pump → pump η · Ps → shaft power Ps
▶ Try it: Pump: change flow and head — watch the water rise and the power change
What the pump needs at its shaft; larger than hydraulic power because of the pump's own losses.
Motor input power
| Symbols | kW; η as fraction | |
| Answer unit | kW | |
| Book topic | Pump power |
Where each value sits: Ps → shaft power Ps · η motor → motor η, input kW · input kW → motor η, input kW
What the electricity meter sees: shaft power plus the motor's losses.
Pump efficiency
| Symbols | kW | |
| Answer unit | % | |
| Book topic | Pump power |
Where each value sits: Ph → hydraulic power Ph · Ps → shaft power Ps · η → pump η
▶ Try it: Pump: change flow and head — watch the water rise and the power change
Useful water power divided by the shaft power; measured in an audit from flow, head and motor kW (× motor efficiency).
Head from a pressure-gauge reading (water)
| Symbols | kg/cm² | |
| Answer unit | m | |
| Book topic | Pump head |
Where each value sits: kg/cm² → pressure gauge kg/cm²
A pressure gauge in kg/cm² converts to metres of water column at about 10 m per kg/cm²; add suction lift (or subtract positive suction head) to get total head.
Affinity law – flow and speed
| Symbols | N = speed (rpm) | |
| Answer unit | m³/hr | |
| Book topic | Affinity laws |
Where each value sits: N → speed N, impeller D
Flow moves in step with speed.
Affinity law – head and speed
| Symbols | N (rpm) | |
| Answer unit | m | |
| Book topic | Affinity laws |
Where each value sits: N → speed N, impeller D
Head varies with the square of speed.
Affinity law – power and speed
| Symbols | N (rpm) | |
| Answer unit | kW | |
| Book topic | Affinity laws |
Where each value sits: N → speed N, impeller D
▶ Try it: Fan laws: slow the fan down — power falls with the CUBE of speed
Power varies with the CUBE of speed — halving speed needs one-eighth of the power; two-thirds speed ≈ 30 %.
Impeller trimming – flow
| Symbols | D = impeller diameter (mm) | |
| Answer unit | m³/hr | |
| Book topic | Impeller trimming |
Where each value sits: D → speed N, impeller D
Trimming the impeller diameter reduces flow in proportion — a one-time, cheap fix for an oversized pump that is throttled.
Impeller trimming – head
| Symbols | D (mm) | |
| Answer unit | m | |
| Book topic | Impeller trimming |
Where each value sits: D → speed N, impeller D
Head falls with the square of the diameter ratio.
Impeller trimming – power
| Symbols | D (mm) | |
| Answer unit | kW | |
| Book topic | Impeller trimming |
Where each value sits: D → speed N, impeller D
Power falls with the cube of the diameter ratio — the saving from trimming.
Friction head at a new flow
| Symbols | friction head (m) varies with the square of flow | |
| Answer unit | m | |
| Book topic | System curve |
Where each value sits: friction → pipe: flow Q
Pipe friction losses rise with the square of flow; static head (the lift) does not change. This is why the system curve is a parabola sitting on the static head.
Pump curve, system curve and speed control
- System curve
- Static head (constant) plus friction head (∝ Q²); the pump runs where its curve meets the system curve.
- Throttling vs speed control
- A throttled valve adds resistance and wastes the head; reducing speed moves the pump curve down — power falls with N³. Throttled > 30 % → trim impeller or fit a VFD.
- NPSH and cavitation
- Net positive suction head available must exceed the pump's required NPSH; otherwise vapour bubbles form and collapse (cavitation). Larger suction pipe, lower liquid temperature and lower suction lift raise NPSHa.
- Pumps in series / parallel
- Series adds head (shut-off head doubles for two identical pumps); parallel adds flow (shut-off head unchanged).
- By-pass lines
- Small by-pass lines protect the pump against overheating at very low or zero flow.
Chapter 7 · Cooling Tower
~13 marks: range/approach/effectiveness, evaporation, COC and blowdown numericals recur; L/G ratio and fill types.


Range
| Symbols | water temperatures (°C) | |
| Answer unit | °C | |
| Book topic | Performance |
Where each value sits: T₁ → T₁ hot water in · T₂ → T₂ cold water out · range → range = T₁ − T₂

▶ Try it: Cooling tower: move the temperatures — range, approach and effectiveness
How much the tower cools the water — set by the PROCESS heat load and flow, not by the tower.
Approach
| Symbols | °C | |
| Answer unit | °C | |
| Book topic | Performance |
Where each value sits: T₂ → T₂ cold water out · WBT → wet-bulb temperature · approach → approach = T₂ − WBT
▶ Try it: Cooling tower: move the temperatures — range, approach and effectiveness
How close the cold water gets to the air's wet-bulb temperature — the true measure of tower performance; lower approach = better (and bigger, costlier) tower.
Cooling tower effectiveness
| Symbols | °C | |
| Answer unit | % | |
| Book topic | Performance |
Where each value sits: range → range = T₁ − T₂ · approach → approach = T₂ − WBT
▶ Try it: Cooling tower: move the temperatures — range, approach and effectiveness
Range as a share of the ideal range (hot water to wet-bulb); 100 % would mean the water reached the wet-bulb.
Cooling capacity (heat rejected)
| Symbols | m = water flow (kg/hr = m³/hr × 1000), Cp = 1 kcal/kg °C | |
| Answer unit | kcal/hr (÷ 3024 = TR) | |
| Book topic | Performance |
Where each value sits: m → circulation rate m³/hr, m, Cp · Cp → circulation rate m³/hr, m, Cp
The heat the tower throws away = water flow × 1 kcal/kg °C × range; divide by 3,024 for TR.
Range from heat load
| Symbols | kcal/hr, LPH | |
| Answer unit | °C | |
| Book topic | Range |
Where each value sits: kcal/hr → circulation rate m³/hr, m, Cp · LPH → circulation rate m³/hr, m, Cp
If you know the heat load and the circulation rate, the range follows — the tower cannot change it.
Evaporation loss
| Symbols | m³/hr, °C | |
| Answer unit | m³/hr | |
| Book topic | Water losses |
Where each value sits: m³/hr → circulation rate m³/hr, m, Cp · °C: °C

▶ Try it: Cooling tower water: raise the cycles of concentration — blowdown falls
Cooling happens mainly by evaporating about 1 % of the water for every 5.5–6 °C of range; this water is lost and must be made up.
Cycles of concentration
| Symbols | ppm (or conductivity) | |
| Answer unit | no unit | |
| Book topic | Water losses |
Where each value sits: TDS circulating → circulation rate m³/hr, m, Cp · TDS make-up → make-up = E + B + D · COC → blowdown B, COC
▶ Try it: Cooling tower water: raise the cycles of concentration — blowdown falls
Because only pure water evaporates, dissolved solids build up; COC says how many times more concentrated the circulating water is than the make-up. Higher COC = less blowdown = less water, until scaling limits it.
Blowdown
| Symbols | m³/hr | |
| Answer unit | m³/hr | |
| Book topic | Water losses |
Where each value sits: m³/hr → circulation rate m³/hr, m, Cp
▶ Try it: Cooling tower water: raise the cycles of concentration — blowdown falls
Water deliberately drained to keep TDS at the chosen COC. Raising COC from 3 to 5 halves blowdown (÷2 vs ÷4).
Make-up water
| Symbols | m³/hr | |
| Answer unit | m³/hr | |
| Book topic | Water losses |
Where each value sits: m³/hr → circulation rate m³/hr, m, Cp
▶ Try it: Cooling tower water: raise the cycles of concentration — blowdown falls
Everything lost must be replaced: evaporation + blowdown + drift (windage, ≈ 0.1–0.3 %).
Liquid-to-gas (L/G) ratio
| Symbols | L, G = water, air mass flow (kg/hr); h = air enthalpy at exit / inlet wet bulb | |
| Answer unit | kg/kg | |
| Book topic | L/G ratio |
Where each value sits: L → L/G = water ÷ air mass · G → air G, density, enthalpy h₁ h₂ · air → air G, density, enthalpy h₁ h₂ · h → T₁ hot water in

Mass of water per mass of air through the tower; the heat lost by the water equals the heat gained by the air, so L/G = enthalpy rise of air ÷ temperature drop of water. Typical 0.75–1.5.
Air mass flow
| Symbols | m³/hr × kg/m³ | |
| Answer unit | kg/hr | |
| Book topic | L/G ratio |
Where each value sits: m³/hr → circulation rate m³/hr, m, Cp
Fan air volume × air density; needed to compute L/G.
% evaporation loss
| Symbols | m³/hr | |
| Answer unit | % | |
| Book topic | Water losses |
Where each value sits: m³/hr → circulation rate m³/hr, m, Cp
Evaporation as a share of circulation — a sanity check (about 1 % per 6 °C of range).
Range, approach and effectiveness
Cooling-tower water balance
- Tower types
- Natural draft (hyperbolic, power plants) and mechanical draft — forced (fan at inlet) or induced (fan at top, most common in industry); counter-flow vs cross-flow.
- Fill
- Splash fill (droplets, 30–45 m²/m³) and film fill (thin film over sheets, 150 m²/m³, more efficient but fouls).
- Drift eliminator
- Captures water droplets carried out in the air stream leaving the tower.
- Factors affecting performance
- Wet-bulb temperature, range, approach, heat load, L/G ratio, fill condition, water distribution. If heat load, range and WBT are fixed, a smaller approach needs a bigger tower.
- Book performance norms
- Approach 2.8–5.5 °C typical; % evaporation ≈ 1 % per 6 °C range.
Chapter 8 · Lighting System
~7 marks, mostly easy objectives: lux/lumen, efficacy ranking, lamp types, T-numbers, CRI; one lumen-method numerical.


Illuminance – inverse square law
| Symbols | I = luminous intensity of the source (book writes it in lumens), d = distance (m) | |
| Answer unit | lux (lm/m²) | |
| Book topic | Basic terms |
Where each value sits: I → lamp: lumens F, watts, efficacy lm/W · d → mounting height Hm, distance d

▶ Try it: Lighting: move the lamp away — illuminance falls with distance²
Light spreads out: doubling the distance from a small source quarters the illuminance on the surface.
Inverse square law – two distances
| Symbols | lux, m | |
| Answer unit | lux | |
| Book topic | Basic terms |
Where each value sits: lux → illuminance E lux, area A · m: m
▶ Try it: Lighting: move the lamp away — illuminance falls with distance²
Same law rearranged to compare two distances.
Lux (definition)
| Symbols | lumen, m² | |
| Answer unit | lm/m² | |
| Book topic | Basic terms |
Where each value sits: lumen → lamp: lumens F, watts, efficacy lm/W · m²: m²
One lumen of light spread over one square metre. Offices need ~300–500 lux, corridors ~100, precision work 1,000+.
Luminous efficacy
| Symbols | lm, W | |
| Answer unit | lm/W | |
| Book topic | Basic terms |
Where each value sits: lm → lamp: lumens F, watts, efficacy lm/W · W → lamp: lumens F, watts, efficacy lm/W
Lumens of light per watt of electricity — the efficiency of a lamp. Ranking: LPSV > HPSV ≈ LED > metal halide > CFL > FTL > HPMV > halogen > incandescent.
Maximum possible luminous efficacy
| Symbols | — | |
| Answer unit | lm/W | |
| Book topic | Basic terms |
Where each value sits: 683 lm/W → lamp: lumens F, watts, efficacy lm/W · 555 nm → lamp: lumens F, watts, efficacy lm/W
If every watt became visible green light at 555 nm (the eye's peak sensitivity) you would get 683 lm — the physical ceiling.
Installed load efficacy (ILE)
| Symbols | lux, W/m² | |
| Answer unit | lux/W/m² | |
| Book topic | Basic terms |
Where each value sits: lux → illuminance E lux, area A · W/m² → lamp: lumens F, watts, efficacy lm/W
How much illuminance you get per watt per square metre — judges the whole installation (lamps + luminaires + layout), not just the lamp.
Installed power density (lighting power density)
| Symbols | W, m² | |
| Answer unit | W/m² (book: per 100 lux) | |
| Book topic | Basic terms |
Where each value sits: W → lamp: lumens F, watts, efficacy lm/W · m²: m²
Watts of lighting per square metre of floor; ECBC limits it (e.g. offices ≈ 10.8 W/m², Ch10).
Room index
| Symbols | L, W = room length, width (m), Hm = mounting height (m) | |
| Answer unit | no unit | |
| Book topic | Lighting design |
Where each value sits: L → room L × W, room index, UF, LLF · W → lamp: lumens F, watts, efficacy lm/W · width → lamp: lumens F, watts, efficacy lm/W · Hm → mounting height Hm, distance d

A shape factor: big low rooms have a high index (light reaches the work plane easily); tall narrow rooms a low one. It is looked up against the luminaire's utilisation factor table.
Mounting height
| Symbols | m | |
| Answer unit | m | |
| Book topic | Lighting design |
Where each value sits: luminaire ht → lamp: lumens F, watts, efficacy lm/W · work-plane ht → illuminance E lux, area A · Hm → mounting height Hm, distance d
Distance from the luminaire down to the work plane (desk height ≈ 0.8–0.9 m).
Light loss factor
| Symbols | MF = maintenance factor (no unit) | |
| Answer unit | no unit | |
| Book topic | Lighting design |
Where each value sits: MF → room L × W, room index, UF, LLF

Lamps dim with age, luminaires and room surfaces get dirty; LLF (≈ 0.7–0.8) allows for this so the design still meets the lux at maintenance time.
Number of fittings required
| Symbols | E = required lux, A = area (m²), F = lumens per fitting, UF = utilisation factor | |
| Answer unit | number | |
| Book topic | Lighting design |
Where each value sits: E → illuminance E lux, area A · A → illuminance E lux, area A · F → lamp: lumens F, watts, efficacy lm/W · UF → room L × W, room index, UF, LLF
The lumen method: total lumens needed ÷ lumens each fitting actually delivers to the work plane.
Space-to-height ratio
| Symbols | m ÷ m | |
| Answer unit | no unit | |
| Book topic | Lighting design |
Where each value sits: spacing → spacing, SHR · Hm → mounting height Hm, distance d
Spacing between luminaires divided by mounting height; keep at or below the luminaire's recommended value (≈ 1.5) for uniform light.
Uniformity ratio
| Symbols | lux | |
| Answer unit | no unit | |
| Book topic | Lighting design |
Where each value sits: lux → illuminance E lux, area A
Minimum lux ÷ average lux on the work plane; aim ≥ 0.7.
Inverse-square law
Lumen method of lighting design
- Lamp families
- Incandescent (efficacy 10–15 lm/W, CRI 100), halogen, FTL (T12 38 mm, T8 26 mm, T5 16 mm), CFL, HPMV, metal halide, HPSV (~120 lm/W, CRI 20–30), LPSV (highest efficacy ~180 lm/W, CRI 10, monochromatic), LED.
- Colour rendering index
- How true colours look under the lamp, 0–100; incandescent/halogen = 100 (best for colour-critical work), LPSV = 10.
- Ballasts
- Electromagnetic ballasts lose 10–15 W per tube; electronic ballasts save 20–30 %, run at high frequency, no flicker.
- Controls
- Occupancy sensors (infrared, ultrasonic, microwave), daylight-linked dimming, timers, task lighting.
Chapter 9 · DG Set System
~11 marks: SFC and efficiency numericals, loss split (exhaust largest), waste-heat recovery, sizing with diversity factor.


Real power of a DG set
| Symbols | kVA, PF | |
| Answer unit | kW | |
| Book topic | DG basics |
Where each value sits: kVA → kVA rating, BHP × 0.746 · PF → kW = kVA × PF, units generated

▶ Try it: DG set: load, PF and specific fuel consumption → litres per hour and efficiency
A genset is rated in kVA at 0.8 PF; the kW it can deliver is the kVA times the power factor of the load.
Apparent power, 3-phase
| Symbols | V (V), I (A) | |
| Answer unit | kVA | |
| Book topic | DG basics |
Where each value sits: V → kVA rating, BHP × 0.746 · I → kVA rating, BHP × 0.746
Alternator output from measured line volts and amps.
Engine power from BHP
| Symbols | BHP | |
| Answer unit | kW | |
| Book topic | DG basics |
Where each value sits: BHP → kVA rating, BHP × 0.746
Engines are rated in brake horsepower; multiply by 0.746 for kW.
Fuel consumption
| Symbols | kW, litres/kWh | |
| Answer unit | litres/hr | |
| Book topic | Performance |
Where each value sits: kW → kW = kVA × PF, units generated · litres/kWh → fuel L/h, SFC, GCV, density

▶ Try it: DG set: load, PF and specific fuel consumption → litres per hour and efficiency
Litres of diesel per hour = kW generated × litres per kWh (the SFC). A DG set at a lower PF generates fewer kW for the same kVA, so burns less fuel.
Specific energy generation
| Symbols | kWh, litres | |
| Answer unit | kWh/litre | |
| Book topic | Performance |
Where each value sits: kWh → kW = kVA × PF, units generated · litres → fuel L/h, SFC, GCV, density
Units per litre of diesel — the everyday DG benchmark (3–4 kWh/L for a healthy set; falls at low load).
DG overall efficiency
| Symbols | 1 kWh = 860 kcal; density (kg/litre); GCV (kcal/kg) | |
| Answer unit | % | |
| Book topic | Performance |
Where each value sits: 1 kWh → kW = kVA × PF, units generated · density → fuel L/h, SFC, GCV, density · GCV → fuel L/h, SFC, GCV, density
▶ Try it: DG set: load, PF and specific fuel consumption → litres per hour and efficiency
Electrical energy out ÷ fuel energy in: units × 860 kcal, over litres × density (0.85 kg/L) × GCV.
Waste heat recoverable from exhaust
| Symbols | temperatures (°C) | |
| Answer unit | kcal/hr | |
| Book topic | Waste heat recovery |
Where each value sits: kWh/hr → kW = kVA × PF, units generated · 8 kg/kWh → exhaust: 8 kg/kWh, Cp 0.25, T in/out · 0.25 → exhaust: 8 kg/kWh, Cp 0.25, T in/out · T exhaust − T out → exhaust: 8 kg/kWh, Cp 0.25, T in/out
Exhaust gas (≈ 8 kg per kWh at ≈ 450 °C) can heat water or make steam down to about 180 °C; the recoverable heat is mass × Cp × temperature drop.
Steam generated from waste heat
| Symbols | enthalpy (kcal/kg) | |
| Answer unit | kg/hr | |
| Book topic | Waste heat recovery |
Where each value sits: enthalpy → steam kg/hr, enthalpy
Recoverable heat divided by the heat needed per kg of steam (steam enthalpy minus feed-water enthalpy).
Heat lost to jacket cooling water
| Symbols | m (kg/hr), Cp = 1 kcal/kg °C, ΔT (°C) | |
| Answer unit | kcal/hr (and kW) | |
| Book topic | Heat balance |
Where each value sits: m → m, Cp, ΔT jacket water · Cp → m, Cp, ΔT jacket water · ΔT → m, Cp, ΔT jacket water
Engine cooling water carries away ~25–30 % of fuel energy; from its flow and temperature rise.
Maximum demand from connected load
| Symbols | kW; diversity factor as fraction | |
| Answer unit | kW | |
| Book topic | Sizing |
Where each value sits: kW → kW = kVA × PF, units generated · diversity → connected load, diversity, load factor, %
Not all loads run at once; the diversity factor gives the realistic peak the DG must carry.
DG set rating
| Symbols | kVA; load factor as fraction | |
| Answer unit | kVA | |
| Book topic | Sizing |
Where each value sits: kVA → kVA rating, BHP × 0.746 · load → connected load, diversity, load factor, %
Size the set so the peak demand is a comfortable load (70–80 %) — running lightly loaded wastes fuel and causes glazing.
Load factor
| Symbols | kW or kVA | |
| Answer unit | % (or fraction) | |
| Book topic | Sizing |
Where each value sits: kW → kW = kVA × PF, units generated
Average load ÷ peak load over the period; a low load factor means a big set idling most of the time.
Cost of generation
| Symbols | Rs/hr, kWh/hr | |
| Answer unit | Rs/kWh | |
| Book topic | Economics |
Where each value sits: Rs/hr → ₹/L, ₹/kWh · kWh/hr → kW = kVA × PF, units generated
Fuel cost per unit generated; compare with the grid tariff to decide when to run the set.
Sankey diagram of a diesel generator
- DG basics
- 4-stroke diesel engine + alternator at 1,500 rpm (4-pole, 50 Hz); rated kVA at 0.8 PF; efficiency ≈ 35 %.
- Losses
- Exhaust gas ≈ 30 % (largest), jacket water ≈ 25 %, radiation ≈ 10 % — recover exhaust heat for steam/hot water, jacket water for absorption chillers.
- Loading
- Run at 70–80 % load; light loading wastes fuel and glazes cylinders. Max PF usable = (engine kW − losses) ÷ kVA.
- Derating
- Output falls with altitude and ambient temperature (book Tables 9.3/9.4).
- Parameters to monitor
- Voltage and frequency (plus current and PF) on the generator panel.
Chapter 10 · Buildings and ECBC
~15 marks: ECBC applicability, envelope terms (WWR, EA, SHGC, U-factor), EPI/star rating, LPD — the 2025 long question was a full EPI/LPD/diversity calculation.


Energy Performance Index
| Symbols | kWh/year, m² | |
| Answer unit | kWh/m²/year | |
| Book topic | Star rating of buildings |
Where each value sits: kWh/year → annual kWh, built-up area m² → EPI · m²: m²


_-_5.jpeg)


_Generator_Set.jpg)


▶ Try it: Building: annual energy and built-up area → EPI and star rating
The building's annual energy per square metre of built-up area — the number used for BEE star rating of offices (lower EPI = MORE stars).
AAhEPI (BPO star rating)
| Symbols | EPI (kWh/m²/yr), hours | |
| Answer unit | (Wh/m²)/hr | |
| Book topic | Star rating of buildings |
Where each value sits: EPI → reflectance + absorptance = 1, emissivity e · hours → hours/day × days/week × 52 → AAhEPI
BPOs run round the clock, so their EPI is normalised by operating hours: watt-hours per m² per operating hour.
Window-wall ratio
| Symbols | m², m² | |
| Answer unit | no unit (or %) | |
| Book topic | Building envelope |
Where each value sits: fenestration area → fenestration area, WWR, VLT, SHGC, U · gross wall area → gross exterior wall area · WWR → fenestration area, WWR, VLT, SHGC, U
How much of the outside wall is glass; more glass = more daylight but more solar heat gain.
Effective aperture
| Symbols | no units | |
| Answer unit | no unit (complies if EA ≥ 0.1) | |
| Book topic | Building envelope |
Where each value sits: VLT → fenestration area, WWR, VLT, SHGC, U · WWR → fenestration area, WWR, VLT, SHGC, U · EA ≥ 0.1 → fenestration area, WWR, VLT, SHGC, U
Daylight potential = how much wall is glass × how much light the glass passes; ECBC wants EA ≥ 0.1 so daylight can replace lighting.
Visible light transmittance
| Symbols | — | |
| Answer unit | no unit (0 to 1) | |
| Book topic | Building envelope |
Where each value sits: light through glazing → fenestration area, WWR, VLT, SHGC, U · VLT → fenestration area, WWR, VLT, SHGC, U
Share of visible light the glazing lets through (clear glass ≈ 0.8, tinted 0.2–0.5).
Solar heat gain coefficient
| Symbols | — | |
| Answer unit | no unit (0 to 1) | |
| Book topic | Building envelope |
Where each value sits: solar gain through glass → fenestration area, WWR, VLT, SHGC, U · incident radiation → incident solar radiation, gain W/m² · SHGC → fenestration area, WWR, VLT, SHGC, U
Share of the sun's heat that gets through the window (directly plus re-radiated). SHGC 0.30 means 30 % of incident solar heat enters; the rest is reflected or re-emitted outside.
Solar heat gain through glass
| Symbols | W/m² | |
| Answer unit | W/m² | |
| Book topic | Building envelope |
Where each value sits: W/m² → incident solar radiation, gain W/m²
Incident solar radiation times the SHGC.
Heat flow through a wall or window
| Symbols | U = U-factor (W/m² °C), A = area (m²), ΔT (°C) | |
| Answer unit | W | |
| Book topic | U-factor |
Where each value sits: U → fenestration area, WWR, VLT, SHGC, U · A → fenestration area, WWR, VLT, SHGC, U · ΔT → fenestration area, WWR, VLT, SHGC, U
The U-factor is the heat that passes through 1 m² for each degree of temperature difference; lower U = better insulation. ECBC max for vertical fenestration ≈ 3.3 W/m²·°C (most zones).
Reflectance and absorptance (opaque surface)
| Symbols | — | |
| Answer unit | no unit | |
| Book topic | Cool roofs |
Where each value sits: reflectance → reflectance + absorptance = 1, emissivity e · absorptance → reflectance + absorptance = 1, emissivity e
Whatever sunlight a roof does not reflect, it absorbs; a cool roof has high reflectance (≥ 0.7) AND high emittance (≥ 0.75) so it also radiates the heat away at night.
Emissivity (thermal emittance)
| Symbols | — | |
| Answer unit | no unit (black body = 1) | |
| Book topic | Cool roofs |
Where each value sits: e → reflectance + absorptance = 1, emissivity e · black body → incident solar radiation, gain W/m²
How well a surface radiates heat compared with a perfect black body (e = 1); cool roofs need high emittance.
Interior lighting power allowance (building area method)
| Symbols | m² × W/m² | |
| Answer unit | W | |
| Book topic | ECBC lighting |
Where each value sits: floor area → annual kWh, built-up area m² → EPI · allowed LPD → lighting W, LPD W/m², floor area · W → lighting W, LPD W/m², floor area
ECBC cap on total lighting watts for a building type = floor area × allowed LPD.
Lighting power density
| Symbols | W, m² | |
| Answer unit | W/m² | |
| Book topic | ECBC lighting |
Where each value sits: lighting W → lighting W, LPD W/m², floor area · floor area m² → annual kWh, built-up area m² → EPI · LPD → lighting W, LPD W/m², floor area
Watts per square metre — compare the actual installed lighting with the ECBC allowance.
UPS efficiency
| Symbols | kW | |
| Answer unit | % | |
| Book topic | UPS |
Where each value sits: output kW → UPS in / out kW · input kW → UPS in / out kW · heat loss → lighting W, LPD W/m², floor area
Output ÷ input; losses become heat that the AC must then remove — double penalty.
Building envelope terms
- ECBC
- Energy Conservation Building Code (2007) for commercial buildings ≥ 100 kW / 120 kVA: envelope, HVAC, lighting, service hot water, electrical power; five climate zones — hot-dry, warm-humid, composite, moderate, cold (NOT 'cold-humid').
- Compliance routes
- Prescriptive (meet each limit), envelope trade-off (EPF — envelope performance factor), whole-building performance (simulation of the entire building).
- Fenestration
- Windows, skylights (slope < 60° from horizontal), glass doors, ventilators — not valves.
- Star rating of buildings
- BEE rates offices, BPOs, hotels, hospitals by EPI bands per climate zone; lower EPI → more stars.
- BEMS / BMS
- Building management system: central control of HVAC, lighting, pumps, with monitoring and scheduling.